📺 Today’s recommended deep-dive video: https://www.youtube.com/watch?v=-O0-HEZAwg8
Speeding Up the Infinite: From Big Data Sampling to Pixel-Perfect Fonts
How do we query petabytes of data in seconds or render perfectly sharp text across infinite zoom levels without crashing the system? This exploration covers two technical breakthroughs—BlinkDB’s sampling magic and multi-channel distance fields—that leverage the raw power of modern hardware to bypass traditional processing bottlenecks.
Core Question: How can we utilize statistical sampling and specialized distance fields to achieve interactive performance without sacrificing critical accuracy?
Highlights
- Sampling acts as a “superpower” by reducing arbitrarily large datasets into fixed-size problems with predictable error margins.
- Stratified sampling is essential for preserving rare but critical data points, such as error codes or performance outliers.
- Modern GPUs act as vector supercomputers that are frequently underutilized by traditional CPU-based font rendering methods.
- Multi-channel distance fields (MSDF) solve the “rounded corner” problem in vector graphics, allowing for resolution-independent text.
⏱️ Reading time: approx. 8 minutes · Saves you about 32 minutes vs. watching.
Want to take notes while watching? Click the image below and let AI Notebook capture the key points for you 👇

The Sampling Superpower in Observability
Why Size Doesn’t Always Matter
Sampling is effectively a superpower because it allows you to take a data problem of arbitrarily large size and reduce it to a problem of fixed size.
When dealing with massive datasets, traditional systems must read every single row, causing latency to scale linearly with data growth. However, a sampling system like BlinkDB only needs to read a fixed amount of data to hit a specific margin of error, regardless of whether the source contains a million or a billion rows. This fundamental shift means you pay a fixed penalty in accuracy to gain an infinite advantage in speed as your data scales.

💡 Digging Deeper
Q: How does the error rate change as the dataset grows?
A: Surprisingly, it doesn’t; the error depends primarily on the sample size itself, not the total size of the source data.
Q: What is the most common mistake when using sampled data?
A: Failing to surface confidence intervals, which can mislead users into thinking a result is more precise than the underlying math allows.
Q: Why should we store the sampling rate in every row?
A: Because sampling rates often change as traffic fluctuates, and you need that specific metadata to bias-correct your aggregates during final computation.
Precision through Stratification
Solving the “Rare Event” Problem
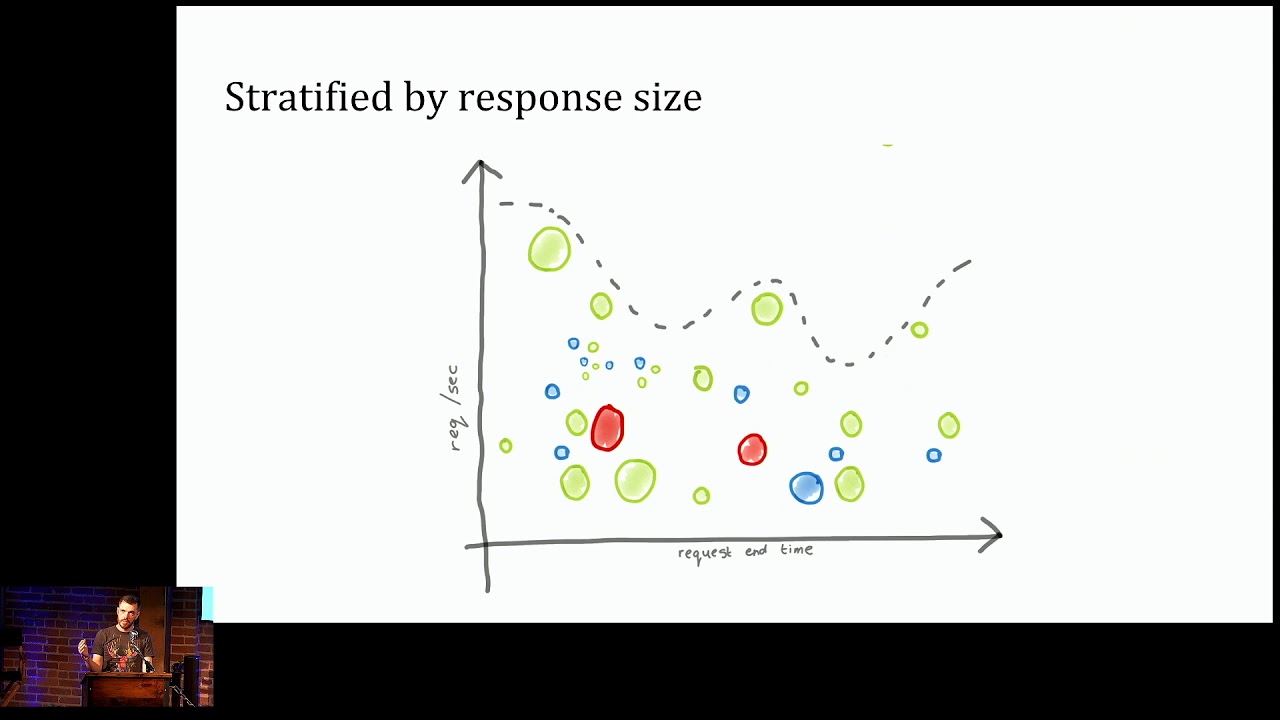
Uniform sampling, where every row has an equal chance of being selected, often fails when you need to analyze rare but important events.
If 99% of your web requests are successful and 1% are errors, a small uniform sample might miss the errors entirely, leaving you blind to your most critical metrics. This is where stratified sampling becomes vital. By ensuring you keep a specific number of items from every category—such as every status code or every response size bucket—you preserve the “interesting” subgroups that would otherwise be filtered away.
Think of it as an intentional bias that you mathematically correct for later to ensure your 95th percentile latency is actually accurate.

The Architecture of Digital Type
The GPU as a Vector Supercomputer
Most modern computers house a series of tiny vector supercomputers known as GPUs, yet we often treat them like simple image displays.
To draw something on a screen, the GPU uses a dataflow DAG that moves from vertices to fragments. It processes fragments in 4-wide vectors, meaning it is most efficient when performing the same mathematical operations across multiple pixels simultaneously. Despite this massive parallel power, our systems frequently fall back on the CPU to pre-render text into “atlases,” which are essentially just static images of letters that cannot be resized without losing quality.
When you zoom in on a standard bitmap font, you aren’t seeing the true geometry of the letter; you are seeing a blurry interpolation of a sample taken at a specific resolution.

Beyond the Blur: Multi-Channel Distance Fields
Capturing Sharp Corners
Distance fields represent shapes not as pixels, but as a field of values indicating how far any given point is from the edge of the shape.
While standard Signed Distance Fields (SDFs) are great for organic, rounded shapes, they struggle with the sharp corners found in typography because the union of circular distance values naturally rounds off edges. Multi-channel distance fields (MSDF) solve this by using three color channels (Red, Green, Blue) to store different distance information. By finding where these different channels agree on the “interior” of a shape, the GPU can reconstruct perfectly sharp corners and intersections.
This technique allows us to render the entire works of Shakespeare—millions of characters—at 60 frames per second with perfect clarity, even at infinite zoom levels.

Key Takeaways
Both sampling and distance fields represent a shift toward smarter data representation. Instead of brute-forcing large datasets or high-resolution images, we can use mathematical proxies—like stratified samples or multi-channel fields—to achieve identical results with a fraction of the hardware effort.
The underlying lesson for engineers is to stop routing around the “superpowers” of our hardware. Whether it’s using the GPU for font rendering or using BlinkDB for interactive analytics, the most efficient systems are those that embrace statistical and geometric approximations to stay responsive in a world of ever-growing data.
Q&A
Q1: Can sampling be used for every type of query?
A1: It is best for aggregates like COUNT, AVG, and SUM. It is less effective for queries looking for a single specific record, which might not be in the sample.
Q2: Why does BlinkDB offer a “time bound” constraint?
A2: It allows users to prioritize speed, telling the system to give the most accurate answer possible within, say, 500ms, facilitating rapid iteration.
Q3: What is a Bezier curve in the context of fonts?
A3: It is a parametric curve defined by control points; fonts use these to describe the mathematical outline of a letter rather than its pixels.
Q4: What is the “winding number” used for?
A4: It’s a mathematical method to determine if a point is inside or outside a complex shape by counting how many times a ray from that point intersects the shape’s boundary.
Q5: Does MSDF take up more memory than standard SDF?
A5: It uses three channels instead of one, so it takes roughly three times the memory per pixel, but it remains vastly more efficient than storing high-resolution bitmaps.
Q6: Is it possible to render text without a font atlas?
A6: Yes, libraries like “Slug” can render directly from Bezier curves on the GPU, though MSDF is often a more pragmatic middle ground for most developers.
Q7: How do you handle aliasing in graphics?
A7: Through multi-sampling or anti-aliasing, which involves taking multiple samples per pixel and averaging them to smooth out jagged edges.